Reference Analytic Morphomic Population (RAMP)

RAMP is the index of the population's bodily measurements
By comparing your patient's measurements to these charts, you can determine bodily composition compared to age- and gender-matched peers, which helps form an overall clinical impression of a patient.
These charts are not designed to be used as a diagnostic instrument, but instead to provide additional information about the patient being measured.
These charts represent measures taken from the RAMP data set v.0.0.4
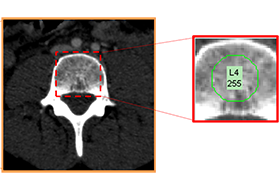
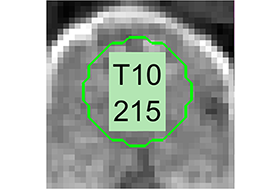
ADD YOUR DATASelect a vertebra...
...and the measurements will appear here.
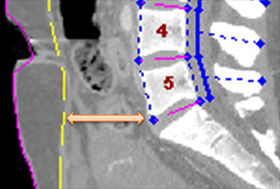
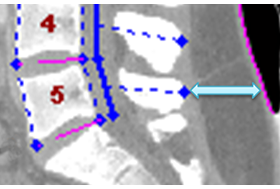
Anterior VB to fascia
@ l5Distance - front of vertebral body to fascia (central visceral size)
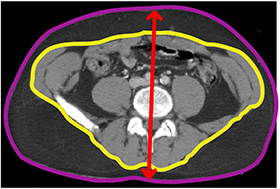
AP Body Depth
@ l4Front-to-back body distance (aligned to body habitus) in mm
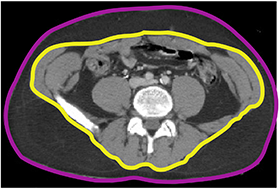
Body X-Sec Area
@ l5Cross-sectional area of the body (area inside purple line) in mm²
DMG LDM to NDM Ratio
@ l2The ratio of low density muscle (LDM) area to normal density muscle (NDM) area within the Dorsal Muscle Group (DMG) boundary. LDM area is defined as the cross sectional area of the DMG falling in a low density muscle HU range (0 to 30). NDM area is defined as the cross sectional area of the DMG falling in a normal density muscle HU range (31 to 100).
DMG LDM to NDM Ratio
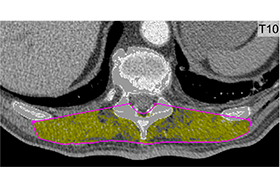
@ t10The ratio of low density muscle (LDM) area to normal density muscle (NDM) area within the Dorsal Muscle Group (DMG) boundary. LDM area is defined as the cross sectional area of the DMG falling in a low density muscle HU range (0 to 30). NDM area is defined as the cross sectional area of the DMG falling in a normal density muscle HU range (31 to 100).
DMG Normal Dens. Mean HU
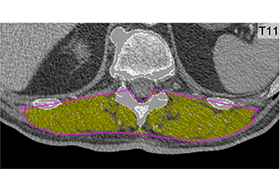
@ t11The mean pixel intensity of the Normal Density Muscle (NDM) area within the Dorsal Muscle Group (DMG) boundary. NDM area is defined as the cross sectional area of the DMG falling in a normal density muscle HU range (31 to 100).
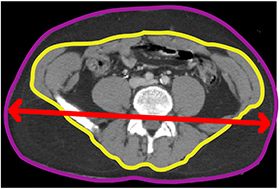
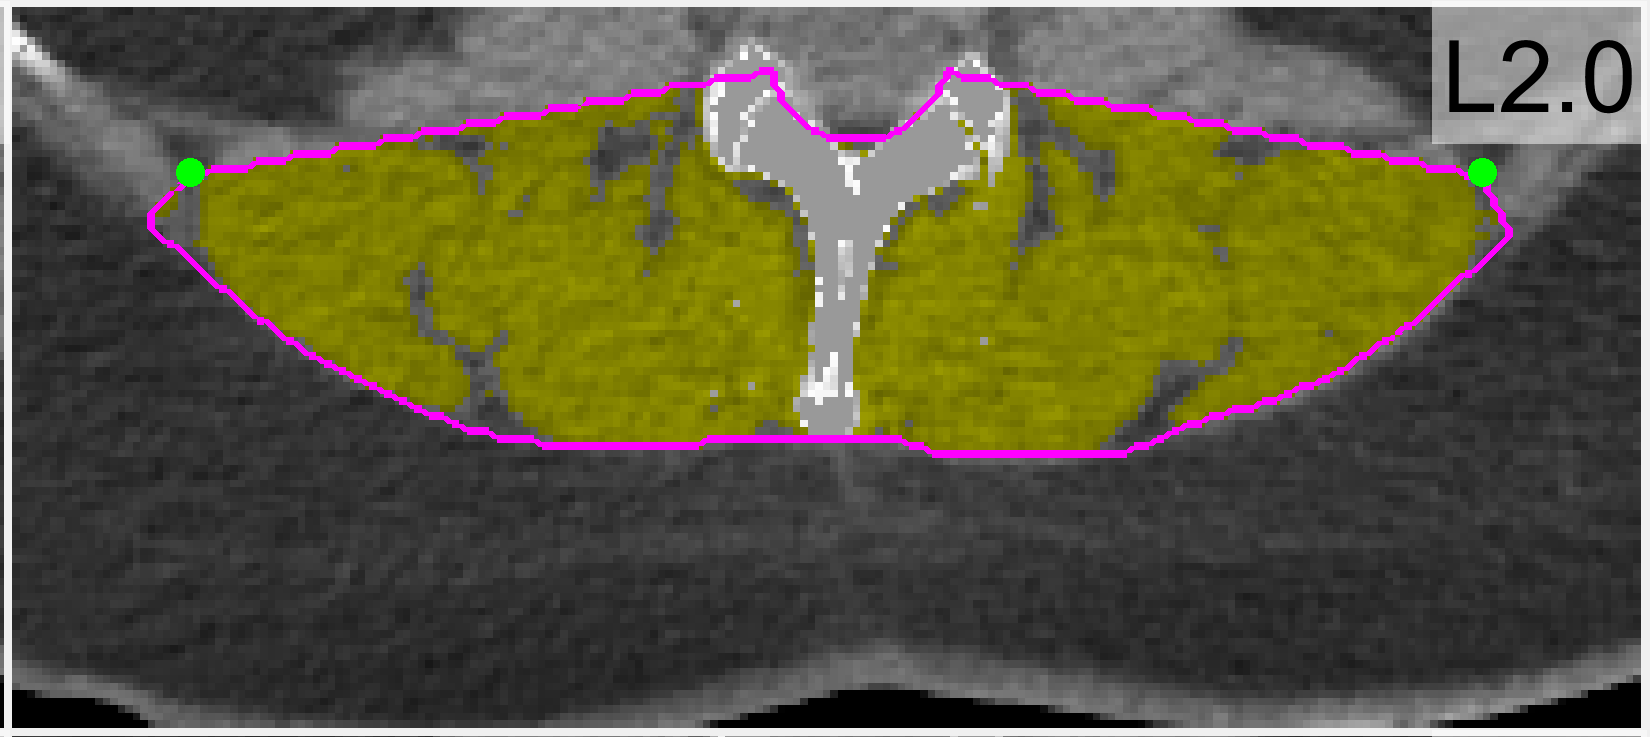
Lat. Body Width
@ l4Left-to-right body distance (aligned to body habitus) in mm
Spinous process to skin
@ l5Distance - posterior tip of spine to back skin (central back fat) in mm
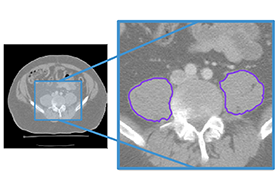
Total Psoas Area
@ l4Total area of the left/right psoas at L4 (region inside blue lines) in mm²
VB trabecular density
@ l4Average pixel intensity (in CT Hounsfield Units) inside central bone core sample.
VB trabecular density
@ t10Average pixel intensity (in CT Hounsfield Units) inside central bone core sample.

Stewart C. Wang, M.D. Ph.D.
Call
(734) 764-7841
© 1995-2019 Regents of the University of Michigan